In each ecosystem, pupils placed a thermometer carefully onto the ground and noted the temperature.
Field sketchPupils drew an annotated field sketch of each site. The pupils then had an image to take back to class with them as a record of what each fieldwork site looked like.
Testing the soil acidity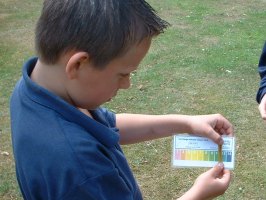
Some soils are slightly acid, some are slightly alkaline. Different plants like different levels of acidity. This test helped to explain why some plants are at different sites.
For this test, the pupils used test tubes, distilled water, indicator paper, spatulas and pH charts. Using the spatula, they took a small sample of soil, put it into the test tube and added a squirt of distilled water. After shaking the tube well, they dipped the indicator paper into test tube and compared the colour of the paper to the colour on the pH chart.
Testing the soil typeDifferent plants like different types of soil: some like clay soils, others like sandy soils. The type of soil also affects how well water can filter through the soil. Different plants like different amounts of water in the soil. This test helped to explain why different plants survive in different places.
Pupils took a sample of the soil from the ground and worked out what type of soil it was by following the instructions on the soil type chart.
Water infiltration rateThis was to find out how well the water filters down through the soil the water content of the soil will affect the plant and animal life living there. Different plants like different amounts of water in the soil. So this test was to help explain why different plants survive in different places.
For this test, the pupils used a 1 litre bottle of water, infiltrometer and a stopwatch. The infiltrometer was pressed firmly onto the ground. The litre of water was poured into the infiltrometer and the water was timed to see how long it took for all the water to infiltrate into the soil.
Quadrat survey of species type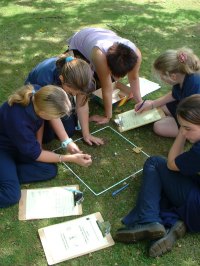
This test was to identify the types of vegetation and the number of different species at the fieldwork site. For this test pupils used a quadrat square and species cards.
The quadrat was placed in an area where there was a variety of vegetation, preferably where some of the plants were in flower. The numbers of different types of plants were counted in the first instance, then the pupils tried to identify what species they could see by making reference to the colour vegetation cards.
Living creaturesPupils noted down any living creatures that they saw.
HumidityThis is the amount of water in the air relative to the amount that it could contain (this varies with temperature cold air cannot hold as much water). A hygrometer was placed on the ground at the beginning of the fieldwork task. At the end of the task the reading was taken.
Problems collecting dataIt was important for the pupils to write down any problems that they experienced when carrying out any of these tests, as it would help them to write a detailed evaluation of the project.
Evidence of human management of the ecosystemPupils were to look around their fieldwork site and look for evidence of people changing the ecosystem in any way? This did not have to be negative people may have changed the look of the area or added something to it in order to protect it. Pupils were to write down any ways in which humans have had an impact on the area, e.g. by building a path made of gravel.
Geography : Priestlands Menu Curriculum Menu Main Heritage Menu